ISM Provides A Reference Point
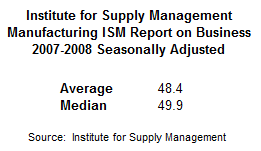
In 2007 and 2008, the average reading of the Institute for Supply Management's (ISM) manufacturing purchasing managers index (PMI) was 48.4; the median reading was 49.9. A PMI reading above 50 indicates that the manufacturing economy is generally expanding; below 50 it is generally contracting. How does ISM's PMI look today? Monday's reading came in at 58.7 or much better than 2007-2008.

How Does The Bigger Picture Compare?
This week's stock market video compares 1987 and 2007 to the present day, allowing us to better understand the odds of a serious and rapid decline in equity prices.
Investment Implications – The Weight Of The Evidence
Since the hard evidence (technicals and fundamentals) remain favorable, we made no changes to our allocation mix of equities (SPY) and bonds (TLT) Monday. Should weakness continue, the S&P 500 has possible support near 2040, 2020, and 2011.

Buyers may surface in technology if the NASDAQ falls back between 4566 and 4610.

If the facts call for a reduction in risk later this week, we will not hesitate to take action. For now, on our timeframe, the last two days fall under the “normal volatility” category.


