
US DOLLAR GAINS ON retail SALES, YIELDS RUN HIGHER
The US Dollar (via DXY Index) has rallied to its highest level of 2018 following this morning's April US Advance Retail Sales report. The look at sales revealed a solid pace of buying by US consumers, underpinning what should be considered a stable growth environment.
Even if the report simply means one less obstacle in the way of the Federal Reserve raising rates again in June, it has proven to be a potent enough catalyst to put the DXY Index on pace for its best day of the month.
DXY Index Price: Daily Timeframe (August 2017 to May 2018) (Chart 1)
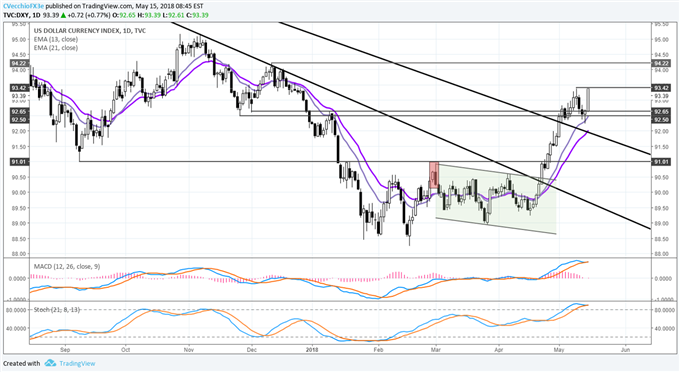
Bullish momentum remains firmly in place for the DXY Index, with price now treating the daily 13-EMA as key support in the uptrend. MACD and Slow Stochastics continue to trade near overbought territory, suggesting that topside momentum is firm. A close through the prior May high of 93.42 would suggest further gains into the December 2017 high at 94.22.
With the US Treasury 10-year yield breaking through its January 2014 high on the way to its highest yield since July 2011, the US Dollar has seen its recent rallies versus lower yielding currencies like the Euro and the Japanese Yen push forward as well.
EURO DROPS AS STREAK OF DATA WEAKNESS CONTINUES
Prior to the release of the US retail sales figures, Q1'18 German GDP figures came in weaker than anticipated, another sign that economic data momentum for the Eurozone remains incredibly weak. More weakness may be ahead for the Euro with the final release of the April Eurzone CPI report due out on Wednesday, which is expected to show another decline.
EUR/USD Price: Daily Timeframe (August 2017 to May 2018) (Chart 2)
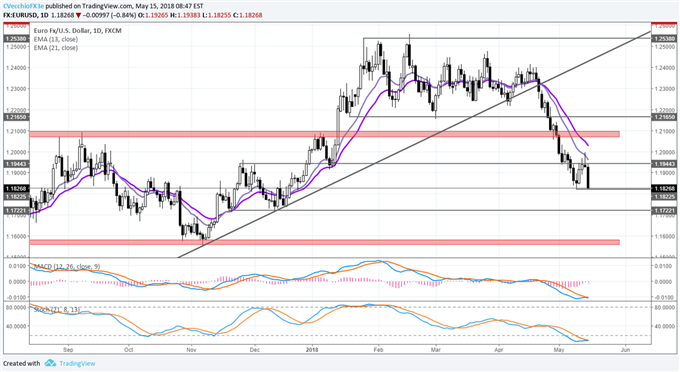
With price momentum firmly negative (EMAs, MACD, Slow Stochastics), EUR/USD is eying a break below its May low at 1.1823 to signal continuation towards the December 2017 swing lows near 1.1720 (corresponding with the measured move higher by the DXY Index). Similar to the DXY Index, price is treating the daily 13-EMA as the key support level in the downtrend.

