
from the St Louis Fed— this post authored by Kevin L. Kliesen
Two major hurricanes hit the u.s. mainland in August (Harvey) and September (Irma).[ 1] Given the population and economic significance of the impacted regions, most forecasters immediately downgraded prospects for the U.S. economy's growth of real gross domestic product (GDP) in the third quarter.

(All data for this article are as of Dec. 1.) Although the hurricanes reduced U.S. employment in September, employment subsequently recovered in October. Despite initial forecasts of a sharp slowdown in third-quarter real GDP growth, the pace of economic activity turned out to be stronger than expected.
Forecasters continue to see above-trend real GDP growth in the fourth quarter, bolstered by the burst in economic activity that normally occurs during the recovery and rebuilding phase after natural disasters.
Economic Effects of Natural Disasters
Typically, natural disasters disrupt activity in three key ways. First, disasters destroy lives, property and other factors of production. These are termed direct losses. These losses reduce the region's and, if large enough, the nation's wealth and tend to adversely affect productivity, income and profits in the short term.
Second, indirect losses occur as a result of the disaster's direct losses. These indirect losses include disruptions to the supply chain, upending the efficient distribution of goods and services, as well as lost sales and increased costs for businesses. Some of these losses (e.g., restaurant meals or airline services) can never be made up.
Finally, natural disasters eventually trigger a rebound in economic activity, as structures, furniture, appliances and vehicles are repaired or replaced. For example, U.S. auto sales rose sharply in September and remained at a high level in October.
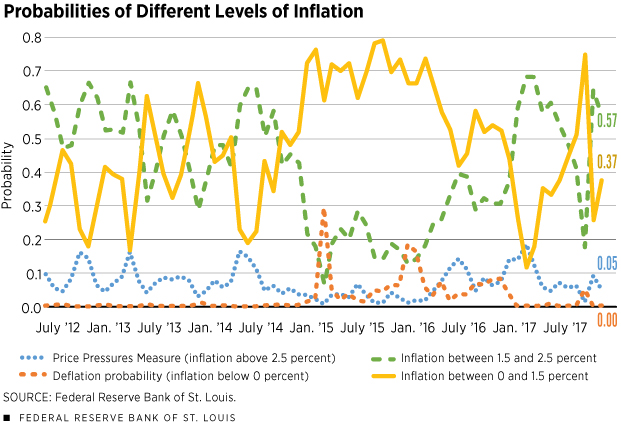
This chart plots the four St. Louis Fed Price Pressures Measures (PPM). Each series measures the probability that the personal consumption expenditures price index (PCEPI) inflation rate over the next 12 months will fall within a certain bucket. The four buckets are as follows: below 0 percent, between 0 and 1.5 percent, between 1.5 and 2.5 percent, and above 2.5 percent. For example, the probability for the above 2.5 percent bucket (“Price Pressures Measure”) is 0.05, which indicates there is a 5 percent probability inflation will exceed 2.5 percent over the next 12 months.

