
Official recession calls are the responsibility of the NBER Business Cycle Dating Committee, which is understandably vague about the specific indicators on which they base their decisions. This committee statement is about as close as they get to identifying their method.
There is, however, a general belief that there are four big indicators that the committee weighs heavily in their cycle identification process. They are:
The Latest Indicator Data

Industrial Production
According to the Federal Reserve, “Industrial production decreased 0.3 percent in April for its fifth consecutive monthly loss. Manufacturing output was unchanged in April after recording an upwardly revised gain of 0.3 percent in March. In April, the index for mining moved down 0.8 percent, its fourth consecutive monthly decrease; a sharp fall in oil and gas well drilling has more than accounted for the overall decline in mining this year. The output of utilities fell 1.3 percent in April. At 105.2 percent of its 2007 average, total industrial production in April was 1.9 percent above its year-earlier level. Capacity utilization for the industrial sector decreased 0.4 percentage point in April to 78.2 percent, a rate that is 1.9 percentage points below its long-run (1972-2014) average.”
The full report is available here.
Today's month-over-month decrease of -0.3 percent (-0.26 percent to two decimal places), came in below the Investing.com consensus of a 0.1 percent increase.
In some respects, Industrial Production is the least useful of the Big Four economic indicators. It's a hodge-podge of underlying index components and subject to major revisions, which undercuts its value as a near-term indicator of economic health. As a long-term indicator, it needs two key adjustments to correlate with economic reality. First, it should be adjusted for inflation using some sort of deflator relevant to production. Second, it should be population-adjusted.
The chart below is another way to look at Industrial Production over the long haul. It uses the Producer Price Index for All Commodities as the deflator and Census Bureau's mid-month population estimates to adjust for population growth. We've indexed the adjusted series so that 2007=100.

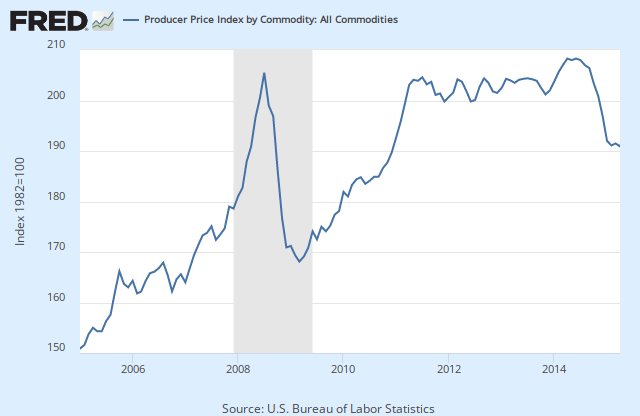
Note that the recent rise in this adjusted indicator is largely a result of a deflationary trend in the All Commodities Price Index that began in mid-2014, as we can see in this snapshot.
We're indebted to Bob Bronson of Bronson Capital Research for pointing out the value of inflation and population adjustments to decipher the Federal Reserve's otherwise misleading Industrial Production data.

