The u.s. Treasury puts the closing yield on the 10-year note at 2.96%.
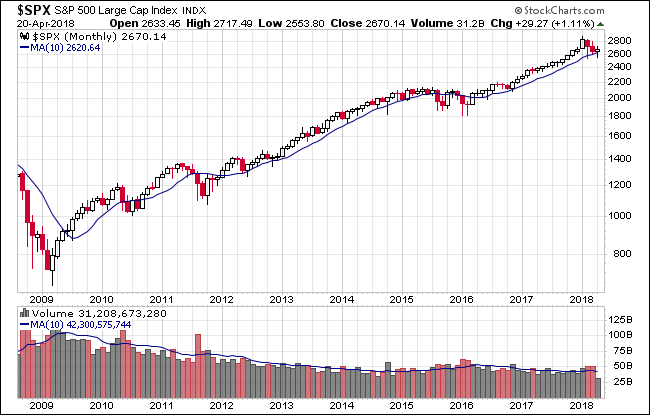
Here's a snapshot of the index going back to December 2008.
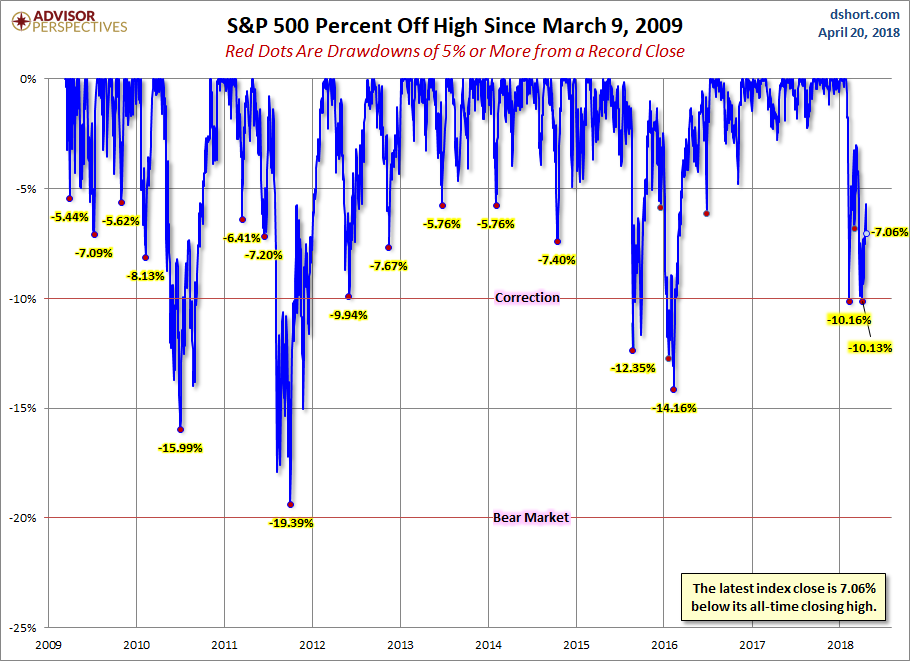
A Perspective on Drawdowns
Here's a snapshot of record highs and selloffs since the 2009 trough.
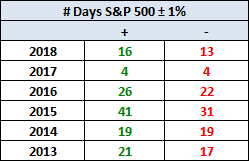
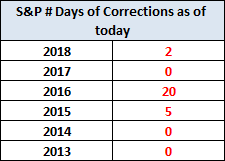
Here's a table with the number of days of a 1% or more change in either direction and the number of days of corrections (down 10% or more from the record high) going back to 2013.
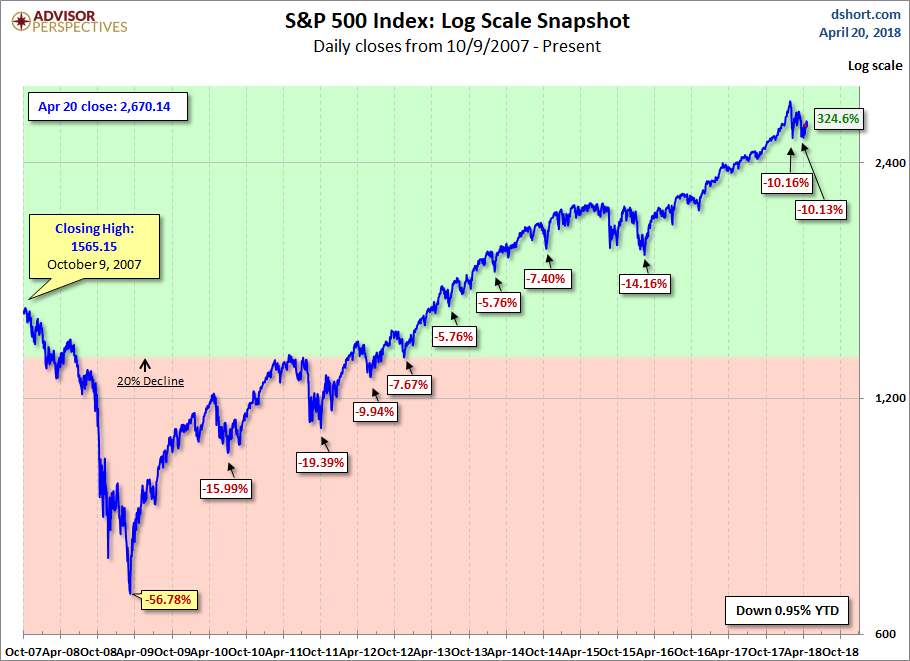
Here is a more conventional log-scale chart with drawdowns highlighted.
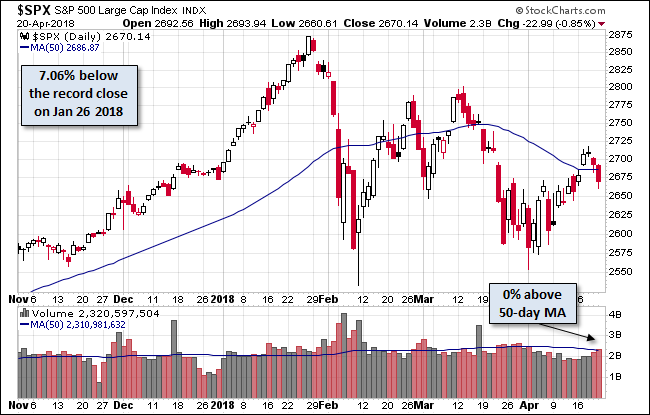
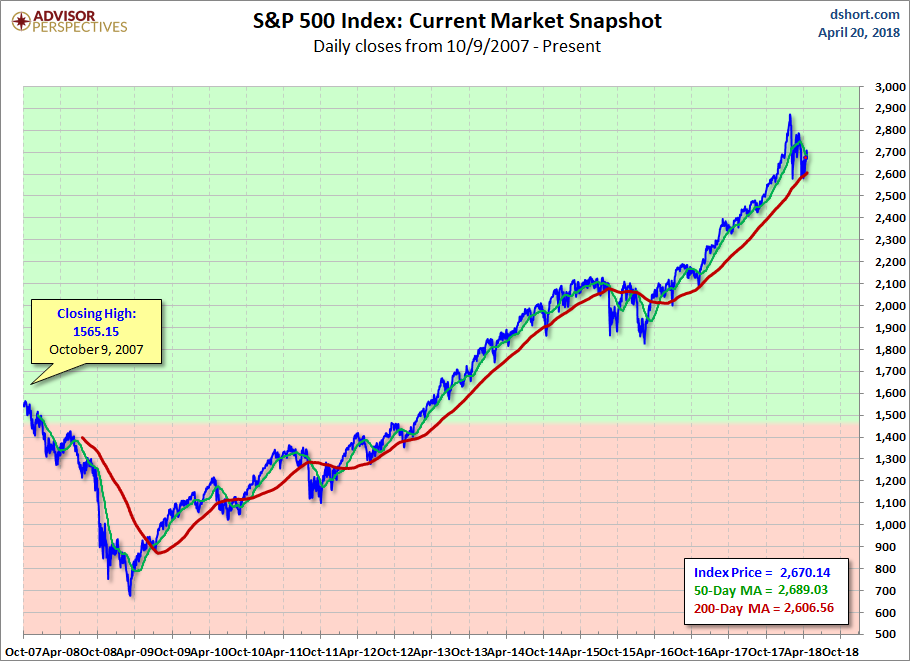
Here is a linear scale version of the same chart with the 50- and 200-day moving averages.
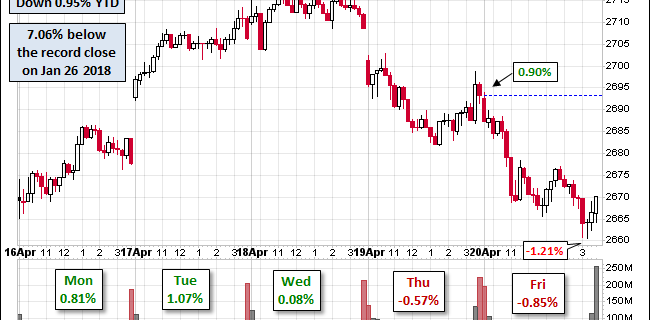
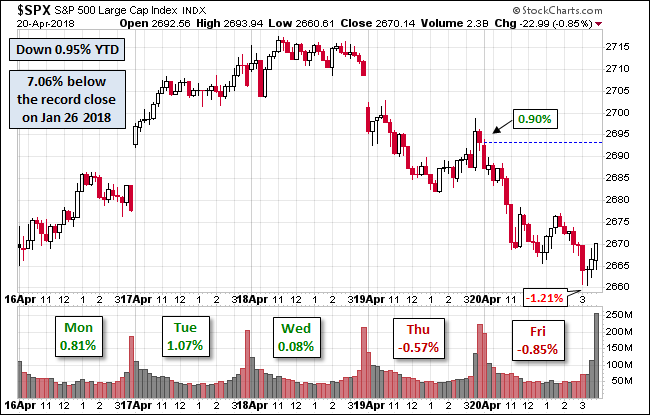
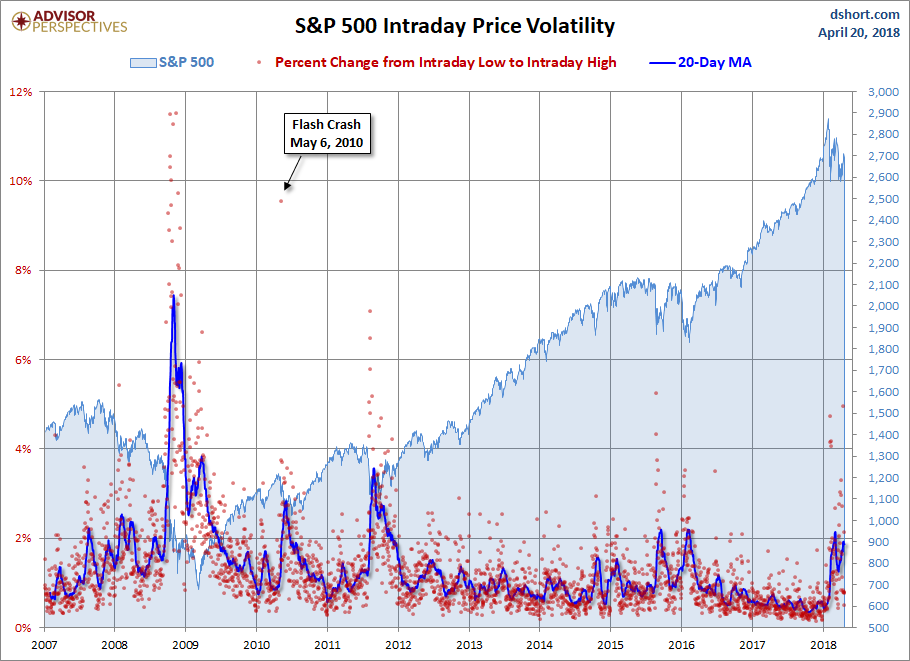
A Perspective on Volatility
Read more updates by Jill Mislinksi

