
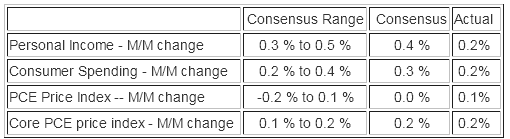
This noisy data series came in below expectations. However the news is not that bad as the year-over-year growth of income is growing faster than expenditures.

The inflation adjusted income and consumption are “chained”, and headline GDP is inflation adjusted. This means the impact to GDP is best understood by looking at the chained numbers. Econintersect believes year-over-year trends are very revealing in understanding economic dynamics.
Per capita inflation adjusted expenditure has exceeded the pre-recession peak.
Seasonally and Inflation Adjusted Expenditure Per Capita

Per capita inflation adjusted income is above pre-recession levels.
Seasonally and Inflation Adjusted Income Per Capita

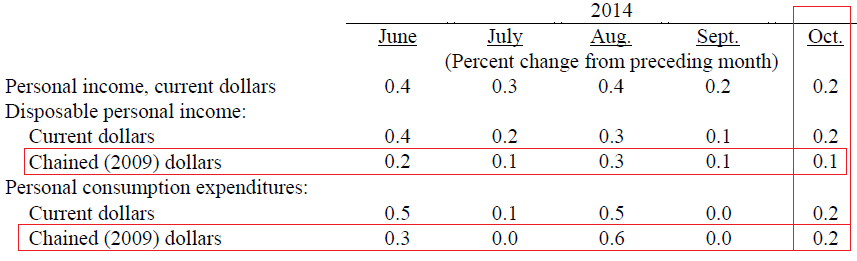
Backward revisions this month:
Estimates for personal income and DPI have been revised for April through September; estimates for PCE have been revised for July through September. Changes in personal income, in current-dollar and chained (2009) dollar DPI, and in current-dollar and chained (2009) dollar PCE for August and September — revised and as published in last month's release — are shown below.
Estimates of wages and salaries were revised from April through September. The revision to second-quarter wages and salaries reflect the incorporation of the most recently available BLS tabulations of second-quarter wages and salaries from the quarterly census of employment and wages. Revised estimates for July, August, and September reflect extrapolation from the revised second-quarter level of wages. In addition, revisions to August and September reflect revised BLS employment, hours, and earnings data for those months.

