by Sam Seiden, Online Trading Academy
As the old saying goes, “risk and reward go hand in hand.” I can't tell you how many times I have heard that in the trading and investing world. Most people think the more reward you try to attain, the more risk you need to take on. Many years ago, I heard this so often that I believed it. However, after many years of trading experience I could not disagree more. It is very possible to attain plenty of reward taking on minimal risk if you know what to look for when analyzing price charts.

Whether you are trading for short term income which means creating a daily, weekly, or monthly income from the markets or investing for long term wealth which means creating annual income/growth to your retirement accounts, the key is buying where banks are buying, and selling were banks are selling. The more precise we can be with analyzing supply and demand, the lower the risk and higher the reward our trading and investing can be.
11/14/14: Supply / Demand Grid DAX Futures Income Trade Profit: $1,431.58
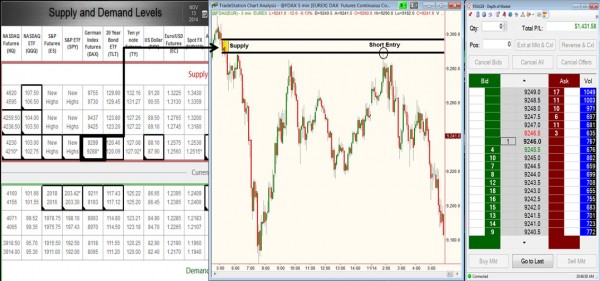
To help you understand this concept, let's go over a trade I took last week utilizing the Supply / Demand grid which is one of our trading services for our students. The trade was in the DAX Futures. On the supply / demand grid, the first row of supply and demand is for short term income trading opportunities. The DAX supply was offered on the grid and can be seen on the chart (yellow shaded area). The price activity there told us that supply exceeded demand, that financial institutions were selling the DAX at that level and that they hadn't sold all that they wanted to sell. In other words, there were plenty of sell orders left at that price level.

