The EUR/USD created a double bottom from where it bounced in a “dead cat” style. Can it recover? Not so fast.
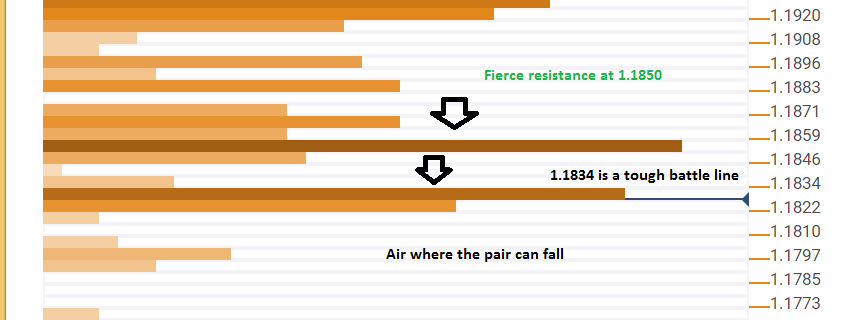
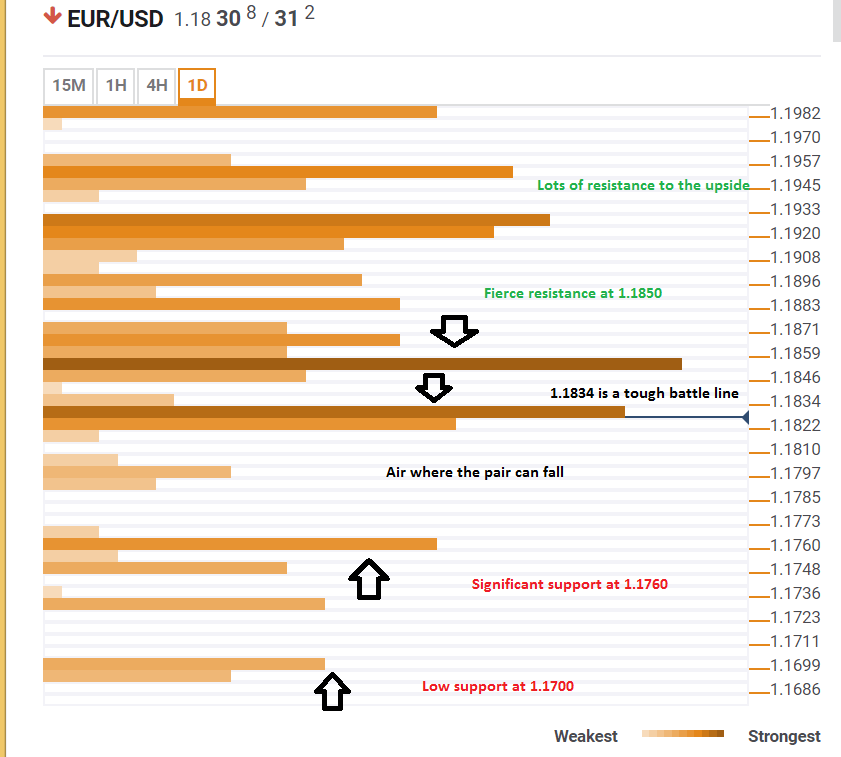
The Technical Confluences Indicator shows that the pair faces resistance around $1.1834 with the convergence of the Pivot Point one-month Support 2, the Bolinger Band one-hour Lower, and the BB 15-Lower. The next significant congestion of potent lines is at $1.1850, where the Fibonacci 23.6% one-day and the Pivot Point one-week S1 meet.
The area above these levels is packed with resistance lines.
On the way down, there is more room. A significant support line appears only at $1.1760, which is the Pivot Point one-week Support 2. Further down, the round $1.1700 level is the Pivot Point one-week Support 3.
All in all, there is a lot of space to the downside and resistance to the upside.
Here is how it looks on the tool:
Confluence Detector
The Confluence Detector finds exciting opportunities using Technical Confluences. The TC is a tool to locate and point out those price levels where there is a congestion of indicators, moving averages, Fibonacci levels, Pivot Points, etc. Knowing where these congestion points are located is very useful for the trader, and can be used as a basis for different strategies.
This tool assigns a certain amount of “weight” to each indicator, and this “weight” can influence adjacents price levels. These weightings mean that one price level without any indicator or moving average but under the influence of two “strongly weighted” levels accumulate more resistance than their neighbors. In these cases, the tool signals resistance in apparently empty areas.

