Our December 2014 Economic Forecast continues to show a stable and growing economy – with a modestly better growth than last month. All portions of the economy outside our economic model – except housing – are showing expansion. There are few warning signs the economy is faltering, and few indications the economy is about to improve its rate of growth. We are truly muddling along.
This post will summarize the:
Special Indicators:
The consumer is still consuming. May through August data are the first times in over six months where ratio of spending to income has fallen under 0.92 – but this spending to income ratio is still historically elevated – and has been elevated since Jan 2013. There has been only four periods in history where the ratio of spending to income has exceeded 0.92 (April 1987, the months surrounding the 2001 recession, from September 2004 to the beginning of the 2007 Great Recession, and between February 2013 and April 2014). A high ratio of spending to income acts as a constraint to any major expansion in consumer spending .
Seasonally Adjusted Spending's Ratio to Income (a increasing ratio means Consumer is spending more of Income)

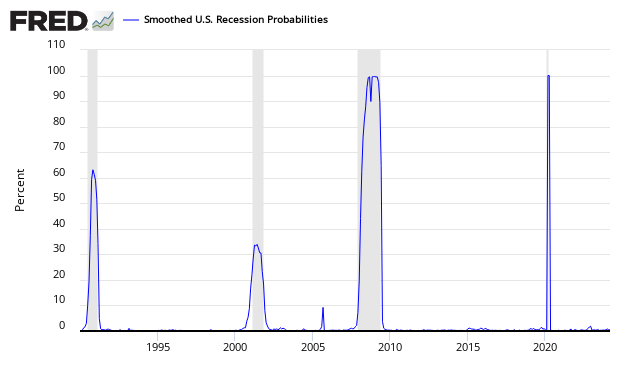
The St. Louis Fed produces a Smoothed u.s. Recession Probabilities Chart which is currently giving no indication of a recession.
Smoothed recession probabilities for the United States are obtained from a dynamic-factor markov-switching model applied to four monthly coincident variables: non-farm payroll employment, the index of industrial production, real personal income excluding transfer payments, and real manufacturing and trade sales. This model was originally developed in Chauvet, M., “An Economic Characterization of Business Cycle Dynamics with Factor Structure and Regime Switching,” International Economic Review, 1998, 39, 969-996. (http://faculty.ucr.edu/~chauvet/ier.pdf)
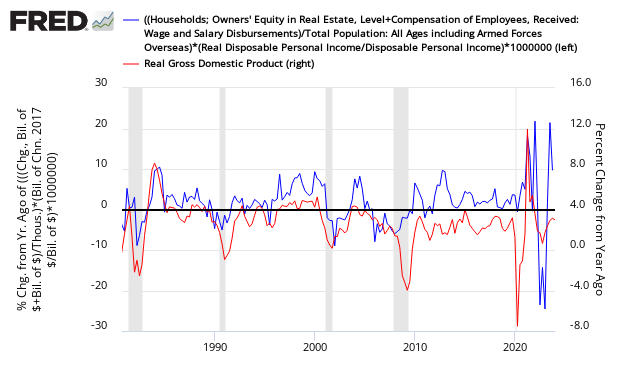
Joe Sixpack's economic position is worse than the previous period (blue line in graph below). The Econintersect index's underlying principle is to estimate how well off Joe feels. The index was documented at a bottom in the July 2012 forecast. Joe and his richer friends are the economic drivers. Joe at the levels associated with past recessions. However, note that this index has falsely warned of recessions that never occurred – but its purpose is not to foresee recession, but stress on the consuming class. This index is updated every quarter – and currently shows Joe under stress. It could also be said that GDP has divorced itself from Joe Sixpack.
Joe Sixpack Index (blue line, left axis)
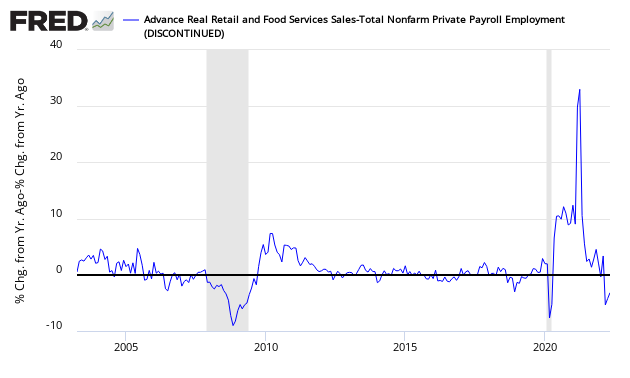
Econintersect reviews the relationship between the year-over-year growth rate of non-farm private employment and the year-over-year real growth rate of retail sales.This index is currently in positive territory. As long as retail sales grow faster than the rate of employment gains (above zero on the below graph) – a recession is not imminent. But this graph clearly points out that over the last two years – this relationship shows that there is little strength in the current and recently past economy.
Growth Relationship Between Retail Sales and Non-Farm Private Employment – Above zero suggests economic expansion