
There are some interesting dynamics in play in the small-cap sector – encompassing both fundamentals and technicals.
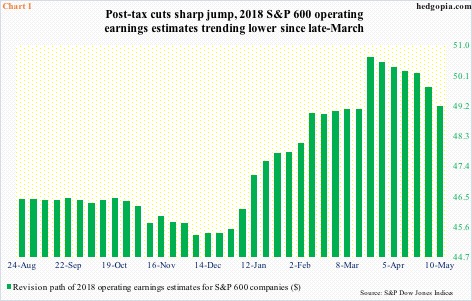
Post-tax cuts of last December, earnings estimates were sharply revised higher. The Tax Cuts and Jobs Act of 2017 was signed into law on December 22. On December 21, operating earnings estimates for 2018 were $145.31 for S&P 500 companies, $97.60 for S&P 400 and $45.41 for S&P 600. As of last Thursday, they respectively stood at $157, $105.93 and $49.19.
In the latest week, 2018 estimates for both S&P 500 and 400 companies fell week-over-week, down $0.65 and $0.73, in that order. The prior week was a record. In the case of the 600, however, estimates peaked a lot earlier – they were $50.66 on March 22 (Chart 1).
This sort of goes against the conventional wisdom that the tax cuts should benefit the domestically-oriented small-cap companies more than their larger-cap brethren, both mid and large. Small-caps' earnings revision trend has decidedly turned lower.
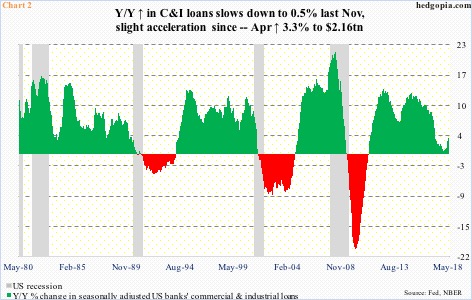
This is also coming at a time when year-over-year growth in US banks' commercial and industrial loans is picking up speed. At least that has been the case in recent months.
In April, C&I loans grew 3.3 percent y/y to a seasonally adjusted annual rate of $2.16 trillion. On an absolute basis, this is a new record. Relatively, though, y/y growth peaked at 12.9 percent in January 2015. By last November, this had decelerated to merely 0.5 percent, followed by slight acceleration since (Chart 2).
It is hard to tell if small businesses are taking part in this latest spurt in borrowing, or to what extent if they are. They do remain optimistic. The NFIB optimism index in April inched up one-tenth of a point month-over-month to 104.8, with February's 107.6 the second highest level in the survey's history (monthly data goes back to 1986).
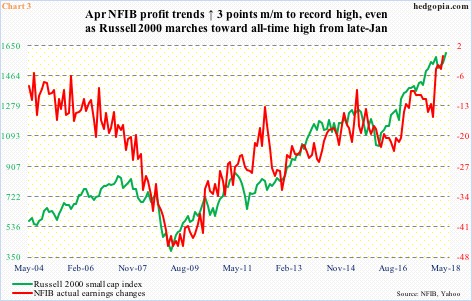
One probable reason behind this jump in optimism is improved earnings.
In April, the frequency of positive profit trends among small businesses rose three points m/m to a new high (Chart 3). Notice the jump in the red line – from minus 15 last December to April's minus one. This particular index measures actual earnings changes, not so much prospects, and for that purpose Chart 1 is where better insight can be had.

