AT40 = 55.2% of stocks are trading above their respective 40-day moving averages (DMAs)
AT200 = 46.4% of stocks are trading above their respective 200DMAs
VIX = 16.9
Short-term Trading Call: cautiously bearish
Commentary
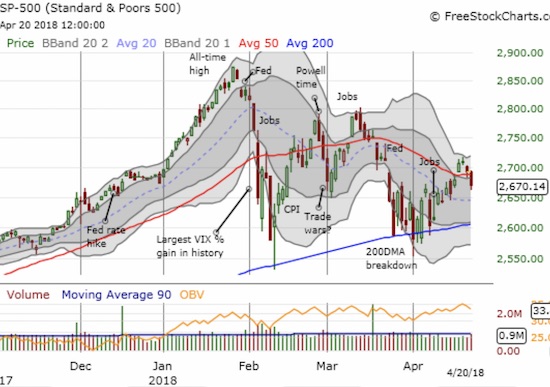
The stock market faded from bullish undertones and back into the resting position. Now we can just look back at what could have been.
This is like a painting from the Renaissance. pic.twitter.com/nhmxYxD0vC
— Frank Pallotta (@frankpallotta) April 22, 2018
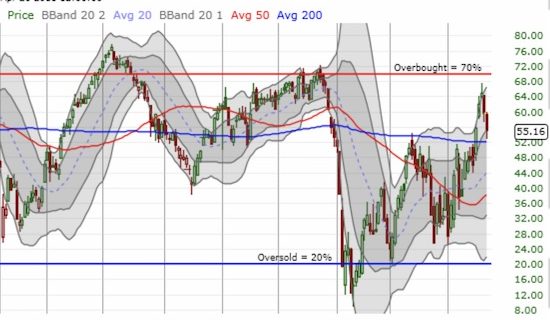
Through Wednesday, April 18th, AT40 rallied relatively consistently with 9 up days out of 12 trading days. The last two up days featured weakening momentum and the top, an intraday high of 67.6%, came just short of the overbought threshold of 70%. I typically interpret a rejection at the overbought threshold as a bearish event. I am particularly keen to follow this interpretation given a similar rejection preceded the big February sell-off, and I was very slow to react to that rejection. AT40 swiftly fell all the way back to 55.2% to close the week. I am now eager to see AT40 hold a higher low.
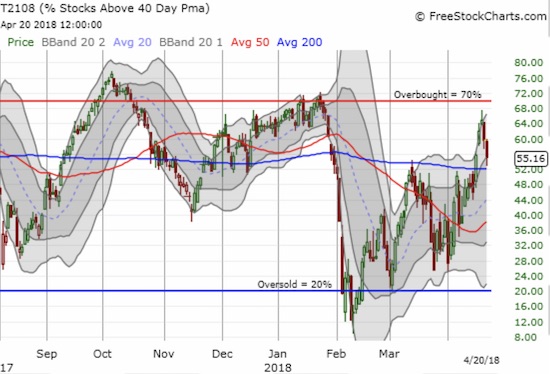
AT40 (T2108) experienced a sharp rejection just under the overbought threshold of 70%. Can it hold a higher low o this pullback?
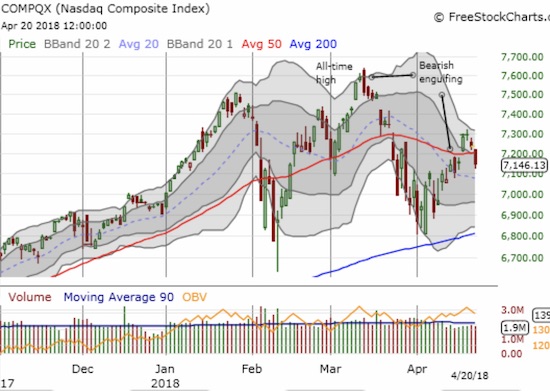
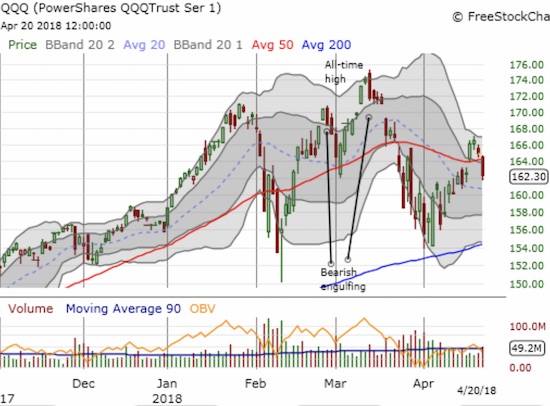
The PowerShares QQQ ETF (QQQ) broke back down below its 50DMA as it too ran out of gas.

