“Davidson” submits:
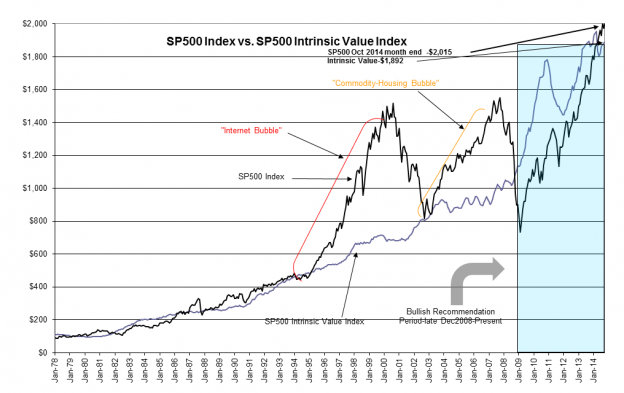
Here is the SP500 Intrinsic Value vs. SP500 again. Only ~5% over priced and housing and commercial construction AND financial inst lending have really not begun. So nowhere near the level of leverage which results in severe corrections.
What others do is make comparisons to nonsensical patterns. The first is using an avg market price without reference to fundamental valuation. You cannot equate anything before 1933 with anything after 1933.
1) Intro of FDIC preserved middle class banking relationships. Individuals who built up equity in businesses and homes held on to these assets as long as they met their financial obligations after FDIC came into being. Before this time if the bank went under then all depositors lost everything, all loans were called and collateral was taken by people who scooped up the loans at huge discounts. Heddy Green did this!!
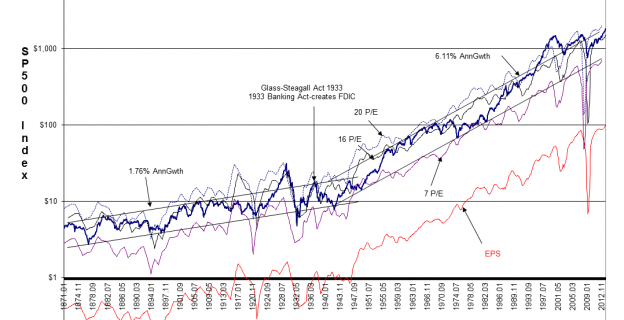
2) Look at my chart of Schiller's information-at bottom. See the break in earnings and SP500 at 1933-1934-The world changed after FDIC.
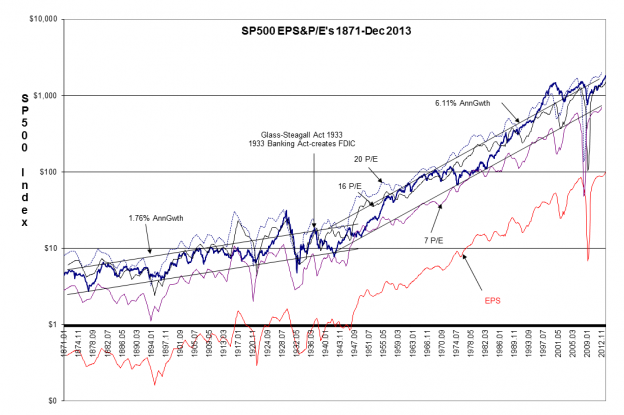
3) SP500 earnings before 1933 grew at 1.76% and afterwards 6.1%.
4) When you use my SP500 Intrinsic Value Index which essentially takes GDP as the capitalization rate and apply it to median SP500 earnings(not the current eps) to gauge SP500 (SPY) pricing it is not so high
5) Lastly, people using borrowed funds charts actually reflects margin from Hedge Funds which now carry $3Tril in assets. Individuals are not using margin at this level.
The analysis is typical of what we are seeing with other widely respected investors. This is why there is so much opportunity for those who see 10yr Treas at 2.3% as the major bubble at the moment. So many feel 2.3% 10yr Treas (IEF) as justified given the conditions. They will not feel this way once rates rise over 5%.

