More than any other asset, gold invokes strongly-defended positions among both its proponents and detractors. Whether you believe gold is “historically the only true form of hard money” or “just a yellow rock with few industrial uses,” it still pays to keep an eye on the price action and evaluate the current trend.
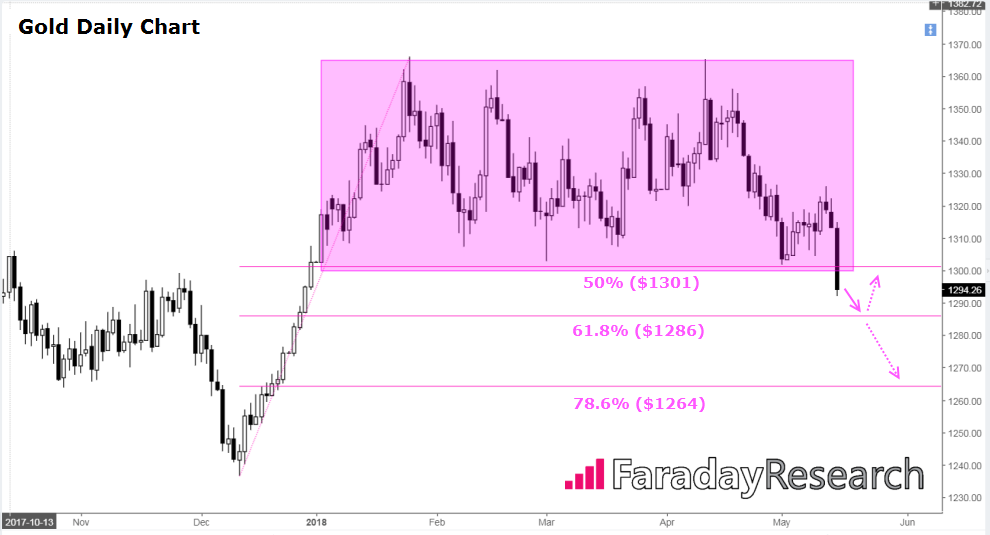
For more than two years, gold hasn't shown much of a trend at all, with prices consolidating between $1200 and $1400 (excluding a brief spike down to the mid-$1100s in Q4 2016). More recently, the metal has spent the entire first third of 2018 trapped between $1300 and $1365, frustrating bulls and bears alike.
That may be changing with today's price action: as of writing, gold is trading hands below $1300, down by more than 1.5% on the back of a breakout in US Treasury yields and the accompanying rally in the greenback:

Source: TradingView, Faraday Research
Of course, bears have been wrong-footed by failed breakouts before, so it may be worthwhile to wait for a daily close to confirm the breakdown. That said, gold is currently trading well below the 50% retracement of the December-January rally, opening the door for a continuation down toward the 61.8% ($1286) or 78.6% ($1264) retracements next. Astute readers will note that the 1260 area provided support twice back in October of last year.
Taking a step back, today's breakout-in-progress in gold serves as a confirmatory indicator of the recent dollar strength. From an intermarket perspective, as long as gold remains below $1300, it will support the near-term “bullish dollar” thesis.


