The global equity market correction has driven a reset in a number of market metrics such as sentiment (both economic sentiment and investor sentiment), fund flows, positioning, volatility, and of particular interest – valuations. Yet as much as there has been a minor adjustment in valuations, a couple of things stay the same…
Today's chart comes from my latest Monthly Chartbook, which presents a compilation of what I think are the key charts to be watching and a summary of views across asset classes.
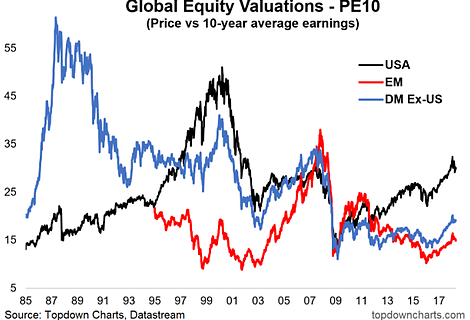
The chart shows PE10 valuations for the USA, Developed Markets ex-USA, and Emerging Markets.
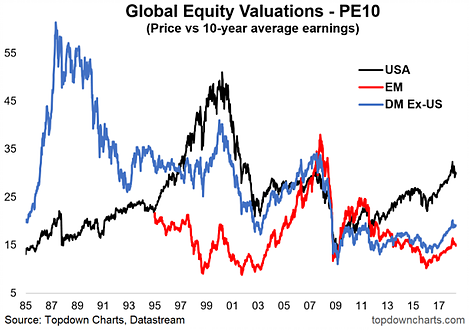
The PE10 valuation metric uses price vs 10-year average earnings (the intention is to smooth out the gyrations seen in trailing 12-month earnings due to recessions and other distortions). The PE10 valuation is in contrast to the two other main types of PE ratio: the trailing 12-month PE (price vs last 12 months earnings) and the forward PE (price vs consensus next 12 months earnings).
As I mentioned, there has been a minor reset in valuations across the 3 markets shown in the chart. The US PE10 fell the most from the high to the latest reading: -2.3pts to 30.1x, then Emerging Markets -1.5pts to 14.9, and Developed Markets excluding-USA fell -1.1pts to 19.1x.
Hidden in those numbers was a clue as to what *hasn't* changed through the correction. And that is that the US remains the most expensive market, and compelling relative value can be found offshore. Also worth noting is the circa-20% discount that EM is trading at vs DM ex-US.
So while valuations overall are slightly cheaper (or perhaps “less expensive”) after the correction, US valuations remain toward the expensive end in absolute terms, and particularly so in relative terms.

