Today, we are highlighting some important Fibonacci price levels and how they should continue to drive price action over the next 3~10 days or so. Let's get started.
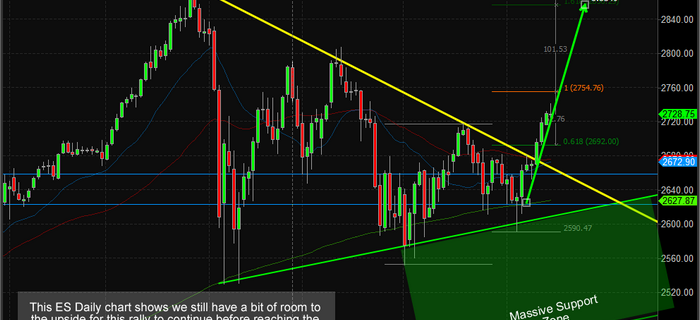
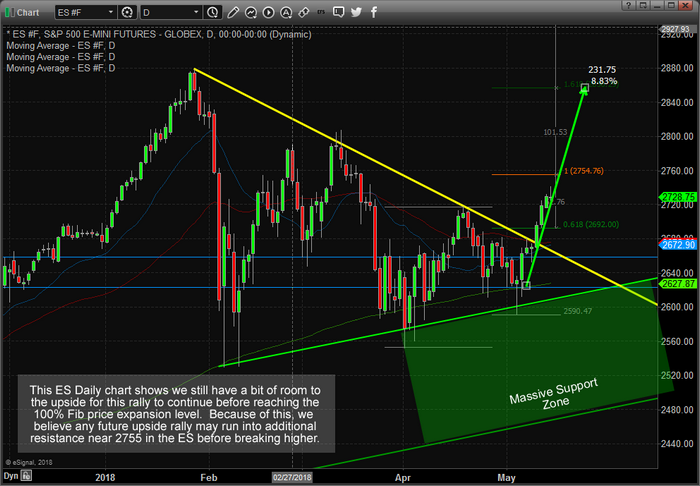
This first Daily ES chart shows a pretty big picture of the Fibonacci price legs (the Fibonacci price “ladder” as we will refer to it in this article) and how these legs work in tandem with other types of support and resistance channels/level as price expands or contracts within new trends. As you probably remember, one of the key factors to understanding Fibonacci price theory is that “price MUST attempt to establish new highs or lows at all times”. Therefore, as we can see by recent price action, new price highs have been reached. This is a clear indication that a new bullish trend is in place and we should now be searching for key levels to enter new trades.
We know the massive support zone exists below 2620 in the ES and we know a critical price channel exists between 2625 & 2660. We don't believe the price will retrace enough to threaten any of these levels. We believe price may retrace to near 2700 before finding additional support and developing a new base for a “ladder move” higher (likely to near 2855).
To confirm this analysis lets take a look at the YM (DOW futures) Daily chart below as well. The Daily YM chart, below, paints a fairly similar example as the ES (S&P500 futures) chart, above). Yet, this YM chart shows that the recent high price is very close to the Fibonacci 100% price level (a “ladder rung”) and should find moderate resistance near this level (24993). We expect price may rotate lower to near 24598 before finding support and establishing a quick, possibly V-shaped or large lower wick type price rotation, bottom that would propel price higher to the next Fibonacci ladder leg near 25937.
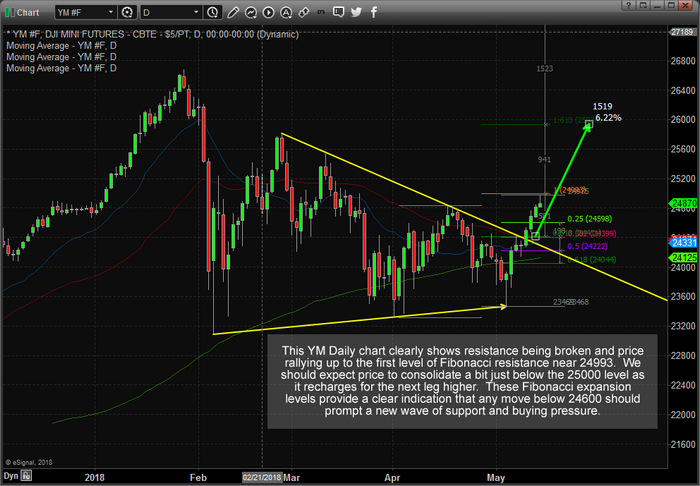
This, zoomed in view of the Daily YM price chart below with our Fibonacci price levels drawn, helps to better understand what we expect to see. As we keep trying to instill into your thinking, “price MUST attempt to establish new price highs or lows as it continues to develop trends and trend reversals in Fibonacci Theory”. Therefore, price MUST attempt to rotate lower after establishing a new price high (as it has done recently) only to FAIL to establish a new price low (which would be a move to below 23460 – a long way away). In doing so, the failure to establish a new price low (through price rotation) would indicate that price MUST do what? That's right, establish another NEW PRICE HIGH.

