
I was underweighted bank stocks heading into the 2016 presidential election and proceeded to watch as they soared immediately following. I didn't jump on the bandwagon because although the reasoning was solid (less regulation, higher interest rates) the stocks seemed to get way ahead of the actual fundamentals (in terms of timing). Below is a chart of the KBW bank index during that time:
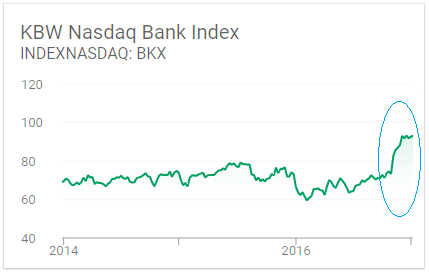
As is often the case when upward moves appear a bit too steep, the stock have since leveled off and moved sideways for the last year or so. I have gotten more interested lately, not only because valuations are more attractive, but because the regulation relief is indeed occurring now and more normal levels of financial market volatility bode well for banks with exposure to the investment side of the business.
To figure out the best companies to focus on, I decided to see what the valuations today we saying about the profitability of the large banks, relative to the return on equity metrics posted for the first quarter, which is the first period where tax rates have come down to the new, lower level.
Oftentimes investors simply look at price-to-book ratios (the most common valuation metric for banks) and assume that the highest ones are fully valued and the lowest are most attractive. While this may be true sometimes, I am more interested in how the market is valuing these banks relative to their profitability outlook. To judge on that level, I prefer to see where price-to-book ratios are, versus where I think they should be based on each bank's fundamentals. To do so, I look at return on equity and look for relative mismatches in the data.
Below are current metrics for six of the largest U.S. banks:
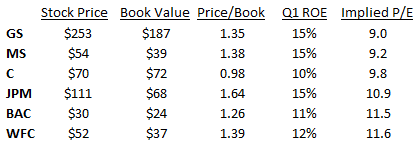
If we only look at price-to-book, we would want to buy Citigroup and short JP Morgan. But since JPM is a best better-managed bank, and earns 50% more on its equity (15% vs 10%), those two banks should not trade at similar P/B ratios.
To balance out the data, I calculate what I call “Implied P/E” which tells us what valuation the market is pricing in, assuming current ROE's remain constant. On this metric, we see that JPM is trading at 10.9x earnings (if they earn 15 cents for every $1 of equity, a P/E of 10 would equate to a price-to-book ratio of 1.50x). Similarly, Citi trades at 9.8x implied earnings.

