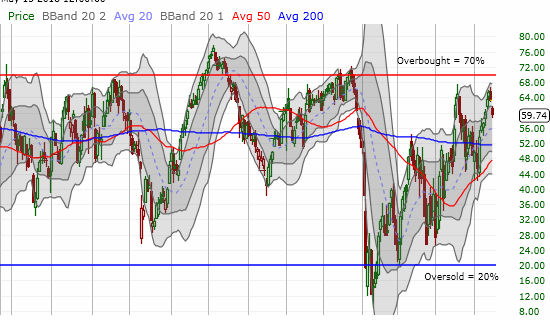
AT40 = 59.7% of stocks are trading above their respective 40-day moving averages (DMAs)
AT200 = 49.1% of stocks are trading above their respective 200DMAs
VIX = 14.6
Short-term Trading Call: neutral
Commentary
Here we are again…again. In the last Above the 40 I observed “the stock market looks like it is breaking free, but there are major caveats which keep me wary and sitting on a neutral short-term trading call.” One of the major caveats reared its ugly head: AT40 (T2108), the percentage of stocks trading above their respective 40DMAs, confirmed resistance at the 70% overbought threshold. The failure started Monday and Tuesday confirmed the failure with a sharp drop back to 59.7%. T2107, the percentage of stocks trading above their respective 200DMAs, also dropped below 50% again.
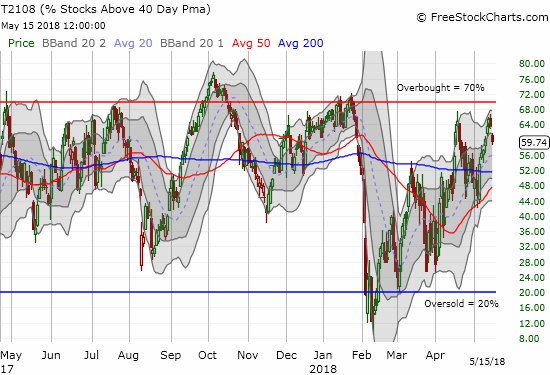
AT40 (T2108) dropped sharply away from the 70% overbought threshold…a move that typically precedes a more significant pullback.
Unless the market makes another 180 degree turn, this inability to break through the 70% overbought threshold exposes the reluctance of buyers. This exhaustion gives an opening to sellers as the move going into this moment rode on a wake of low volume. The S&P 500 (SPY), the Nasdaq, and PowerShares QQQ ETF (QQQ) all gapped down on the day losing 0.7%, 0.8%, and 1.1% respectively. Each index closed at the bottom of upper-Bollinger Band (BB) channels. This pullback puts the 50DMAs right back into play for a test of support.
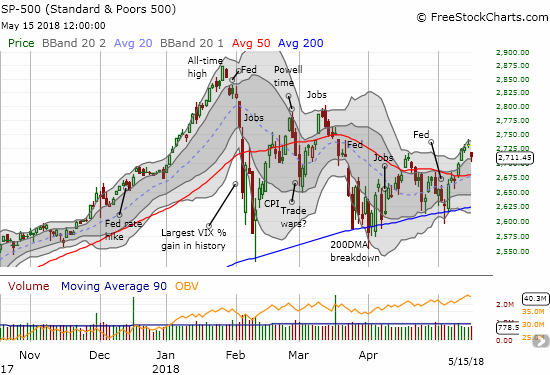
The S&P 500 (SPY) bounced off its lower part of its upper-Bollinger Band (BB) uptrending trading channel. Buyers managed to keep the index just above the peak from the last rally.
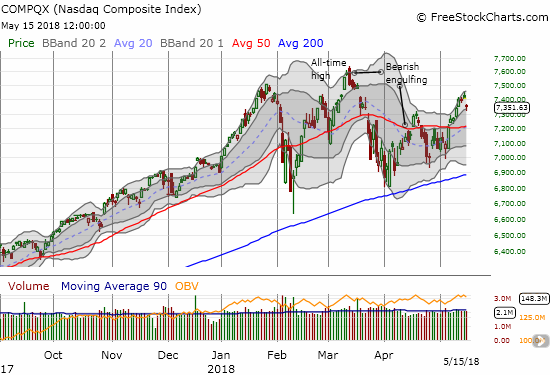
The Nasdaq gapped down and then bounced off the lower part of the upper-Bollinger Band (BB) uptrend.
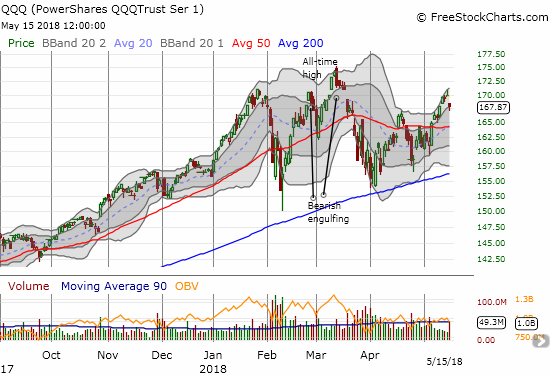
The PowerShares QQQ ETF (QQQ) cracked its upper-BB trading channel but buyers managed to recover just enough to save the uptrend.
The GOOD news in each chart is the pattern of higher lows and higher highs as a part of the bounce from the March and April lows. Still, if the previous patterns persist, the S&P 500 is not only in for a test of 50DMA support but also in for yet another test of 200DMA support.

